BFCM 2026 runs from Thanksgiving (Thursday, November 26) through Cyber Monday (Monday, November 30), and the 2025 season says the same thing from every direction: shoppers spent more online than ever, they bought earlier in the week, they expected a deal, and they did it on a phone. Plan for an earlier start, a value-led offer instead of the deepest possible discount, and a mobile checkout that does not leak.
This post is the data half of our BFCM refresh: what the 2025 numbers actually show, where the sources disagree, and what that means for your calendar and your margins. The mechanics half, with offer setup, margin arithmetic and a week-by-week timeline, is in our BFCM promotion playbook. Every figure below links to the page where we read it on October 1, 2026.
Key takeaways
- Spend keeps growing at a steady single-digit pace in the US (Adobe: Cyber Week up 7.7%, the full Nov-Dec season up 6.8%) while Shopify merchants grew faster (up 27% in dollars, 24% in constant currency).
- Black Friday outgrew Cyber Monday in Adobe’s data for the second year in a row, and Klaviyo saw the opposite order in its brand cohort. Plan for the whole five days, not one peak day.
- Average discounts did not climb in 2025. Klaviyo measured 26.2% versus 29.6% a year earlier, and brands with the lightest discounts grew fastest in its data.
- Mobile carried the majority of online sales, and wallet and buy now pay later (BNPL) payments are a growing share, which changes where an upsell can safely appear.
- Early 2026 forecasts point to another growth year (Deloitte: e-commerce up 7.5% to 8.4%), with AI-driven discovery as the biggest new variable.
The 2026 calendar: a day later, one day longer
Thanksgiving falls on the fourth Thursday of November, so the BFCM window moves a little every year. In 2025 it ran Thursday, November 27 to Monday, December 1. In 2026 it runs one day earlier on the calendar, and Cyber Monday lands on November 30, the last day of the month.
| 2025 | 2026 | |
|---|---|---|
| — | — | — |
| Thanksgiving | Thu, Nov 27 | Thu, Nov 26 |
| Black Friday | Fri, Nov 28 | Fri, Nov 27 |
| Cyber Monday | Mon, Dec 1 | Mon, Nov 30 |
| Days from Thanksgiving to Dec 25 | 28 | 29 |
| Christmas Day | Thursday | Friday |
The 2025 dates match Adobe’s own definition of Cyber Week as the five days from Thanksgiving to Cyber Monday, and the day counts are plain calendar arithmetic. Two practical consequences follow. First, there is one more day of runway before Christmas than last year, but the window is still short. Second, Cyber Monday now closes out a month, so if your finance team reports monthly, the whole five-day event falls inside November.
Shipping cutoffs still decide how late the season can run. USPS recommends sending items by December 17 for Ground Advantage and First-Class Mail, December 18 for Priority Mail and December 19 for Priority Mail Express to arrive before December 25. If your last-chance promotion ends after those dates, say clearly on the page which orders will arrive by Christmas.
What actually happened in 2025
Four organizations measure BFCM, and each measures something different. Mixing their numbers into one story is the most common mistake in BFCM recaps, so here they are side by side with what each one counts.
| Source | Headline result | What it measures |
|---|---|---|
| — | — | — |
| Adobe | Cyber Week $44.2B online (up 7.7%); Black Friday $11.8B (up 9.1%); Cyber Monday $14.25B (up 7.1%) | US online sales, from Adobe Analytics visits to US retail sites |
| Salesforce | $336.6B global (up 7%); $79.6B US (up 5%) | Global industry sales from Salesforce shopper data, Nov 25 to Dec 1 |
| Shopify | $14.6B (up 27%); 81M+ buyers; average cart $114.70 | Sales by Shopify merchants over the BFCM weekend |
| NRF | 202.9M shoppers (a record); 134.9M online (up 9%) | A consumer survey with Prosper Insights, not sales |
Adobe’s full-season release adds the wider frame: $257.8 billion online from November 1 to December 31, up 6.8%, with 25 days above $4 billion in a single day, up from 18 the year before. NRF’s retail monitor put total holiday retail sales (online and in-store) at 4.1% growth, inside its 3.7% to 4.2% forecast. In other words, online is growing roughly twice as fast as retail overall, and Shopify merchants grew faster than the US online average.
A note on the Shopify figure. The 27% increase is in dollars across all Shopify merchants worldwide, and Shopify states 24% on a constant currency basis. It is a platform-wide total, so it is not the growth you should expect for your own store. For a single store, Adobe’s 7% to 9% range is a more sober planning baseline, and your own 2025 data is better still.
Insight 1: demand moved earlier in the week
Adobe reports that Cyber Monday growth was outpaced by Black Friday for the second year in a row, “as consumers embraced earlier deals.” Thanksgiving Day itself brought in $6.4 billion online, up 5.3%. NRF’s survey tells a consistent story about the weekend: online shoppers on Saturday rose to 63 million from 53.9 million a year earlier, and Sunday drew 38.7 million online shoppers. Black Friday remained the top shopping day by shopper count, but its online total of 85.7 million was slightly below 2024’s 87.3 million.
Here is a conflict worth knowing about. Klaviyo’s cohort of brands saw Cyber Sunday as the fastest-growing day at nearly 14%, with Cyber Monday up 11% and Black Friday up 10%, which is the reverse of Adobe’s Black Friday-first result. The two are not contradictory. Adobe counts dollars across the US web, while Klaviyo counts same-site sales for a stable group of brands that run heavy email and SMS programs. Brands that message their customers can pull demand toward a day of their own choosing, and that is exactly the lever you control.
Our reading (assessment, not fact): the weekend is now a five-day shopping window with several peaks, and the first peak can arrive before Black Friday. A store that opens its offer at midnight on Friday is already late for the shoppers who browse on Thanksgiving. The playbook post turns this into a dated timeline, including an early-access step for your best customers.
Insight 2: discounts held steady, and basket size did the work
Discount depth is the number every merchant asks about, and the sources give you three different views.
Adobe measures list-price discounts on products it tracks. In 2025 those peaked at 30.9% off in electronics (30.1% in 2024), 29.6% in toys (28%), 25.1% in apparel (23.2%), 24.3% in televisions, 23.4% in computers, 20.3% in sporting goods, 20.2% in appliances and 18.8% in furniture. Those actuals ran deeper than Adobe’s own October forecast, which expected electronics at 28% off and toys at 27%. If you plan against forecasts, leave room for the market to be more aggressive than predicted.
Klaviyo measures discounts across its ecommerce brands. Overall discounts fell nearly 10%, from 29.6% to 26.2%, the first break in a multi-year climb in promotional intensity by its account. Daily averages never exceeded 30%, and the peak came on Small Business Saturday at roughly 28% in the US, against roughly 26% on Black Friday and 24% on Thanksgiving. The most interesting result is the growth of the lightest discounters: brands offering the smallest discounts saw the highest growth, up 14%. Klaviyo’s own explanation is that those brands relied on personalization, timing and recommendations rather than markdowns. Home and garden was the exception, where deeper markdowns were needed to move bigger-ticket items.
Salesforce measures price and volume. Across Cyber Week the average selling price rose 6% while order volume grew 2% globally and 1% in the US. On Black Friday alone, per TechCrunch’s report of Salesforce data, prices were up an average of 7% while order volumes were down 1%. Put together, growth in 2025 came mostly from higher prices per item and bigger baskets, not from more orders.
What this means for a Shopify store:
- Revenue growth did not require deeper discounts. Where it came, it came from larger baskets and higher-ticket items. Adobe notes that the share of units sold for the most expensive goods rose 20% against the rest of the year, and by 56% in electronics and 55% in sporting goods.
- Discount elasticity depends on price point. Klaviyo found low-AOV brands got their best email open rates at 20% to 29% off and mid- and high-AOV brands at 30% to 39%. Note that this is a subject-line open-rate result, not a sales result, so treat it as a clue about attention and test it against your own revenue.
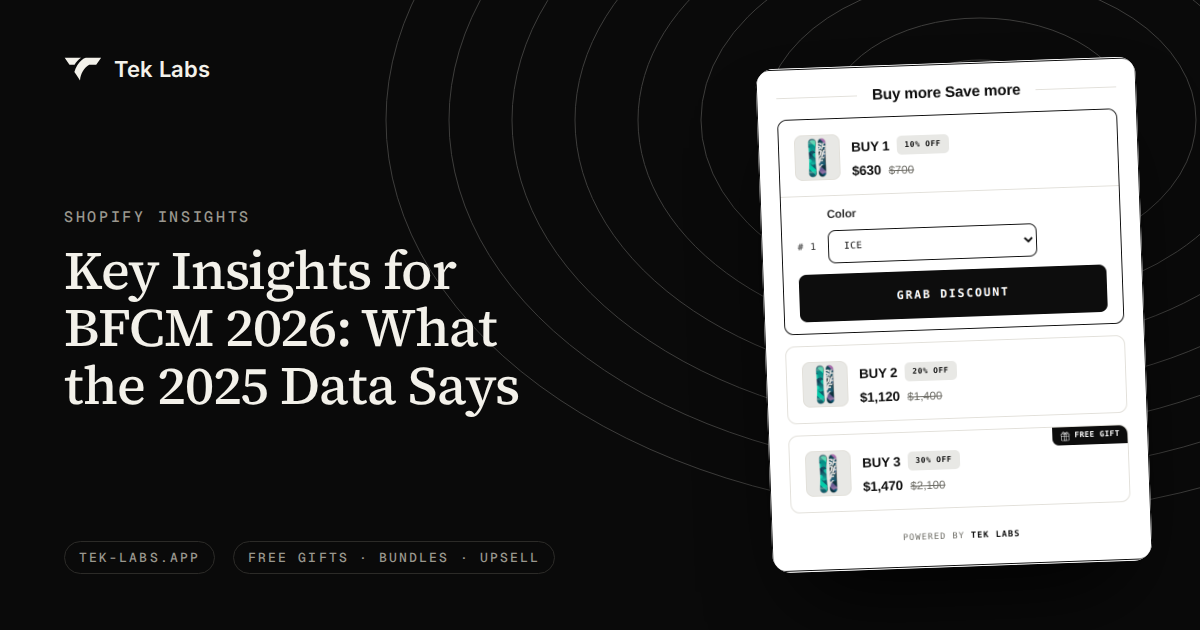
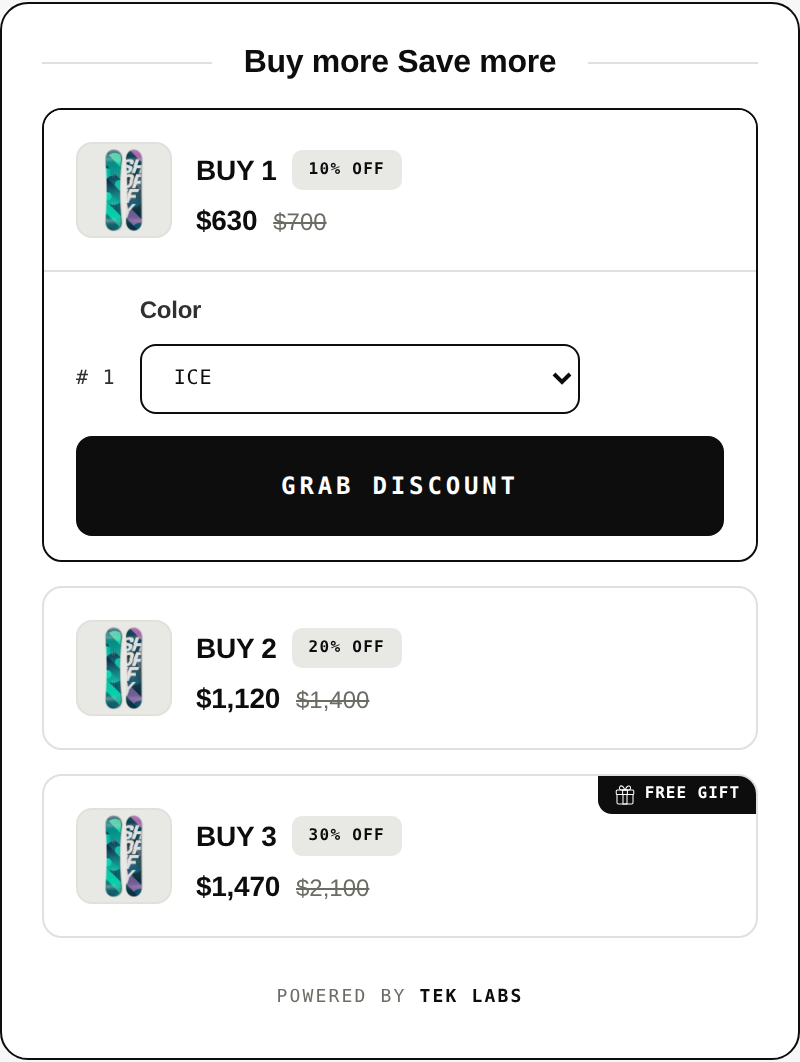
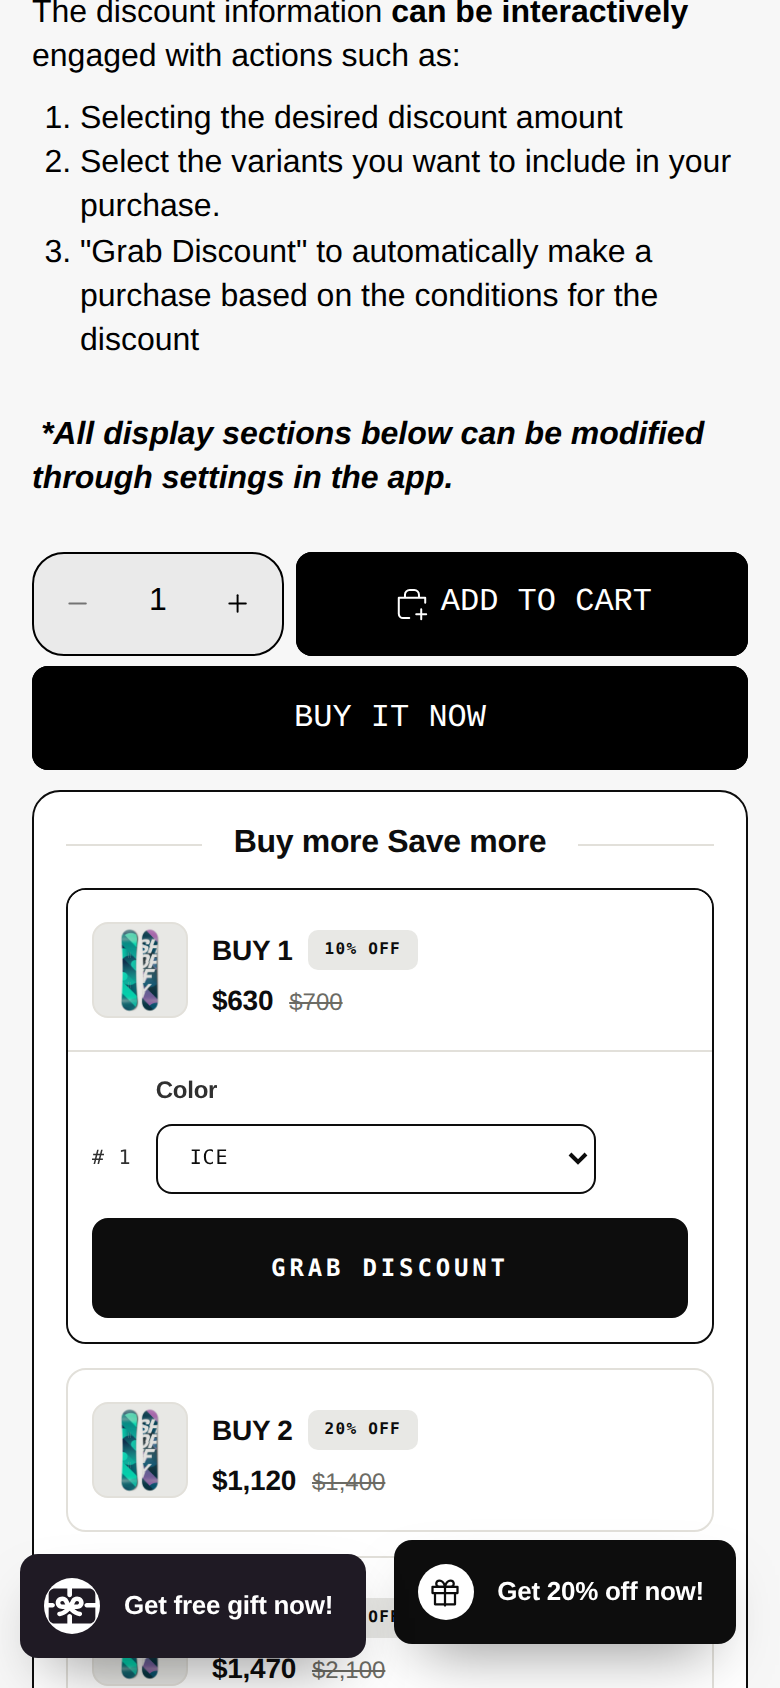
- Tools that raise the basket (thresholds, tiers, bundles, quantity breaks) fit this pattern better than a deeper sitewide percentage. The arithmetic of why is worked through in the promotion playbook.
Insight 3: mobile is the majority, and checkout speed is the product
Adobe reports that 56.4% of online spend across the 2025 season came through a smartphone (up from 54.5%), and on Cyber Monday the share was 57.5%, or $8.2 billion. Salesforce counts orders instead of dollars and reports mobile at 70% of online orders both globally and in the US, with mobile wallets used for 27% of global orders and 29% in the US. NRF’s survey found 46.9 million of Cyber Monday’s 75.9 million online shoppers used a mobile device. Shopify reported that 32% of orders on its platform used Shop Pay, with sales through Shop Pay up 39%.
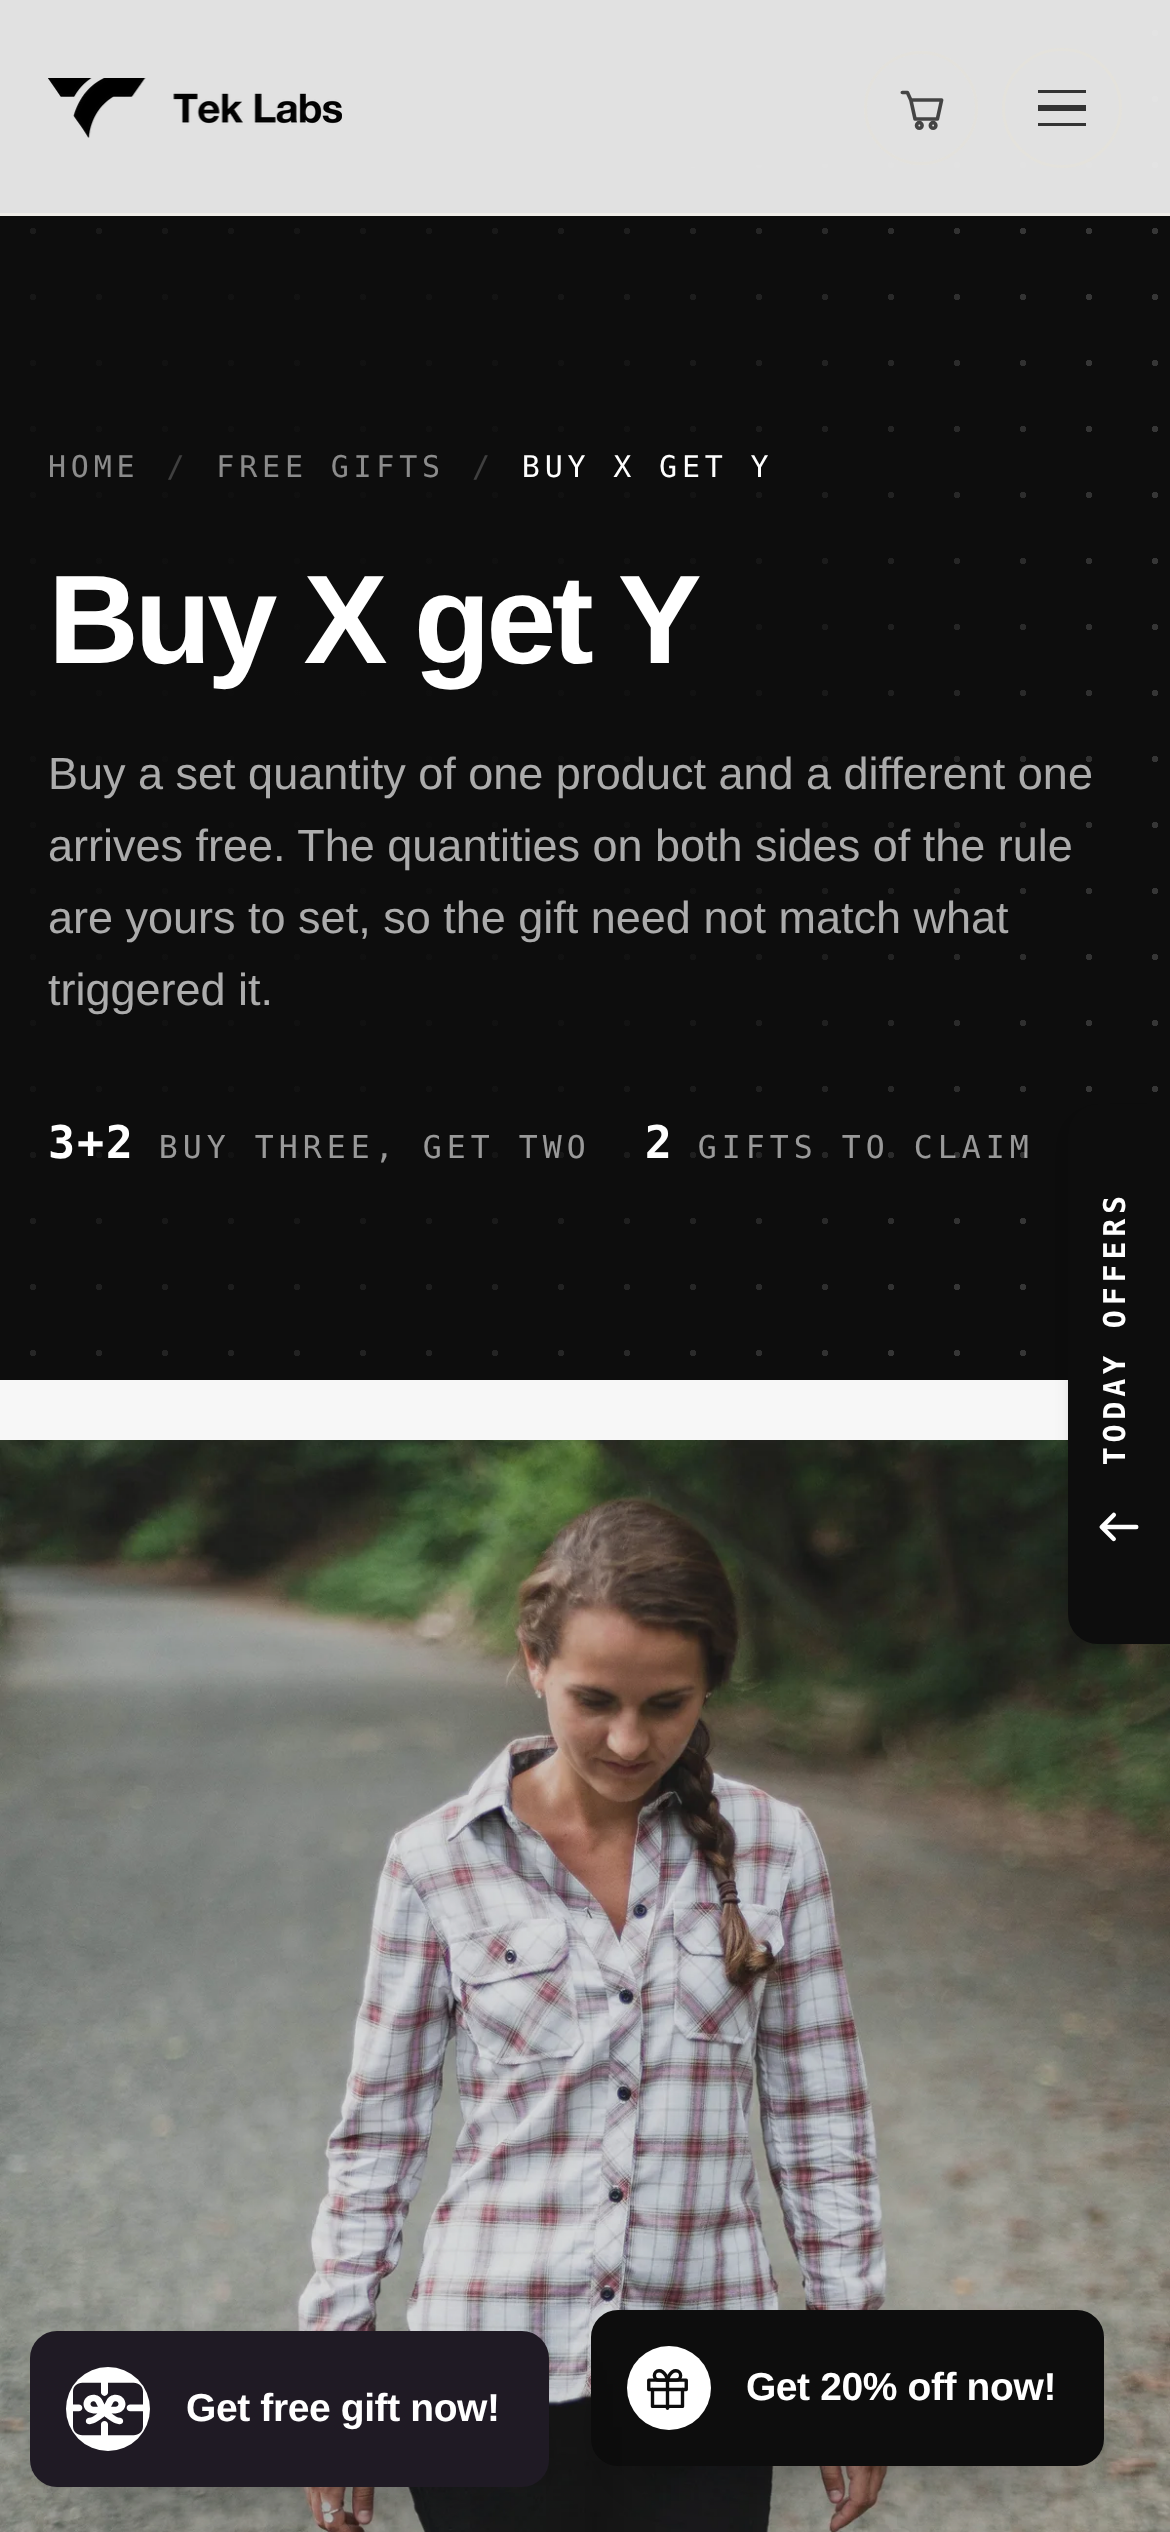
The percentages differ because of what is counted: spend (Adobe) versus orders (Salesforce) versus people (NRF). Phones are used for cheaper, faster purchases, so the share of orders is higher than the share of dollars. Pick one definition and compare your own data to it. For store design, the practical point is simple: your offer has to be readable and usable on a small screen, including the progress bar, the gift choice and the cart.
Adobe also found a gap between buying and returning. Mobile drove 56.4% of spend, but only 38.8% of returns happened on a mobile device, so shoppers still go back to a desktop to return items. If your returns portal is not mobile-friendly that will not show up in BFCM, but it will show up in January.
Insight 4: BNPL and wallets change where you can upsell
Adobe reports that buy now pay later reached $20 billion in the season (up 9.8%), that 82.2% of BNPL purchases came from a smartphone, and that Cyber Monday was the biggest BNPL day on record at $1.03 billion. Wallets and installment services are increasingly how the phone shopper pays.
This has a consequence that few BFCM guides mention. Shopify’s developer documentation states that the post-purchase page is not shown when the customer checks out with an installment service or a wallet service (it names Klarna, Affirm, Afterpay, Apple Pay, Amazon Pay and Google Pay), when the first purchase used a gift card, or on orders with duties and multiple currencies. If a large share of your phone traffic pays by wallet, a post-purchase upsell will reach only part of it. That does not make post-purchase offers a bad idea. It means the cart is the place for your core offers, and the post-purchase page is a bonus for shoppers who pay by card. Our playbook covers how to size that in the margin examples.
Insight 5: AI discovery is real, but still small
Adobe measured a 693.4% increase in traffic to US retail sites from generative AI tools across the season, and 670% on Cyber Monday. It added a caution that matters: “the base of users remains modest.” Salesforce counts a different thing, orders that AI and agents influenced, at $67 billion or 20% of global orders, through recommendations and customer service conversations. Influence is a wider measure than referral, so the two numbers should not be compared.
For 2026, Salesforce predicts that 20% of holiday ecommerce traffic will originate from AI chat agents and that one in three ecommerce sites will have a site-specific shopper agent by Cyber Week. Treat those as vendor predictions. We would plan around what is verifiable and cheap:
- Keep product titles, descriptions, prices, shipping terms and return policy pages complete and consistent, because assistants quote them.
- State the offer in plain text on the page (not only in an image), including the threshold, the dates and the exclusions.
- Do not rebuild your store for AI traffic in October. At a few percent of visits, it is a monitoring item, not a project.
Insight 6: categories, loyalty and social
Adobe’s category totals show where online dollars went in 2025: electronics $59.8 billion (up 8.2%), apparel $49.0 billion (up 7.4%) and furniture $31.1 billion (up 6.6%) accounted for 54% of the $257.8 billion. Smaller categories grew faster: groceries up 10.2%, cosmetics up 9.3%, toys up 7.8% and sporting goods up 7.7%. Shopify’s own list of hottest BFCM categories was cosmetics, clothing tops and pants, activewear, and fitness and nutrition. Klaviyo’s cohort saw health and beauty up 14% and apparel up 11%.
Repeat customers drove more growth than new ones. In Klaviyo’s data, revenue from repeat buyers grew about 13.5%, outpacing new buyers, after brands used early access, exclusive drops and VIP perks instead of blanket discounts. On the acquisition side, Adobe found social media’s share of revenue rose to 4.6% (up 40.3%), and Salesforce measured social at 15% of global digital traffic to retailer sites. Paid and owned channels remain larger, but social is the fastest-moving one.
Insight 7: the season does not end on Cyber Monday
Adobe notes that returns were down 1.2% versus the prior year over the holiday season, yet in the days after Christmas (December 26 to 31) returns were up 4.7%, and one of every seven returns happened in that window. Free gifts and bundles complicate returns, because a returned item that was part of a qualifying order may have triggered a gift or a discount. Decide your return rules for gifted items before the sale and publish them with the offer, not after. The margin examples in the playbook include a returns allowance for exactly this reason.
The 2026 outlook so far
As of early October 2026, the forecasts we could verify are these.
| Source | Forecast or signal | Note |
|---|---|---|
| — | — | — |
| Deloitte (Sept 10, 2026) | E-commerce $316.1B to $318.9B, up 7.5% to 8.4%; total holiday retail $1.70T to $1.71T, up 4.0% to 4.8% | Covers November 2026 through January 2027 |
| Salesforce | 20% of holiday traffic from AI chat agents; social commerce to grow 9x faster than traditional ecommerce; $4.8B more spent on free shipping | Vendor predictions |
| Adobe, Prime Day 2026 via Fortune | $26.4B across US retailers June 23 to 26, up 9.3%; electronics and apparel discounts about 24% | A summer event, but a sign of how shoppers behave in 2026 |
Deloitte describes shoppers as showing “value-seeking behaviors across income levels, including switching among brands and retailers and using promotions to manage spending.” At the time of writing we did not find a 2026 holiday forecast from Adobe or NRF, so treat the picture as incomplete and check again in late October. Salesforce’s prediction that retailers will spend more on free shipping is a reminder that a free shipping threshold is now table stakes. Our guide to smart free shipping strategies covers how to set one without giving away margin.
From data to a plan: what to decide before mid-October
| Signal in the data | What it suggests | Decision to make now |
|---|---|---|
| — | — | — |
| Growth mostly from larger baskets, not more orders | Reward basket size, not just price cuts | Pick one threshold-based offer for the cart |
| Discounts flat at about 26% to 30% average | Shoppers expect a deal but not a record one | Set a margin floor and a maximum percentage |
| Peaks spread across five days | One midnight launch is too late | Plan an early-access step for repeat buyers |
| Majority mobile, wallets rising | Cart offers reach more people than checkout offers | Test the offer on a phone, in the cart |
| Returns spike after December 26 | Gifts and bundles need clear return rules | Write the policy before the sale |
| AI traffic small but fast-growing | Clean, consistent product and policy data | Audit titles, prices and policy pages |
How to read your own 2025 BFCM data in 30 minutes
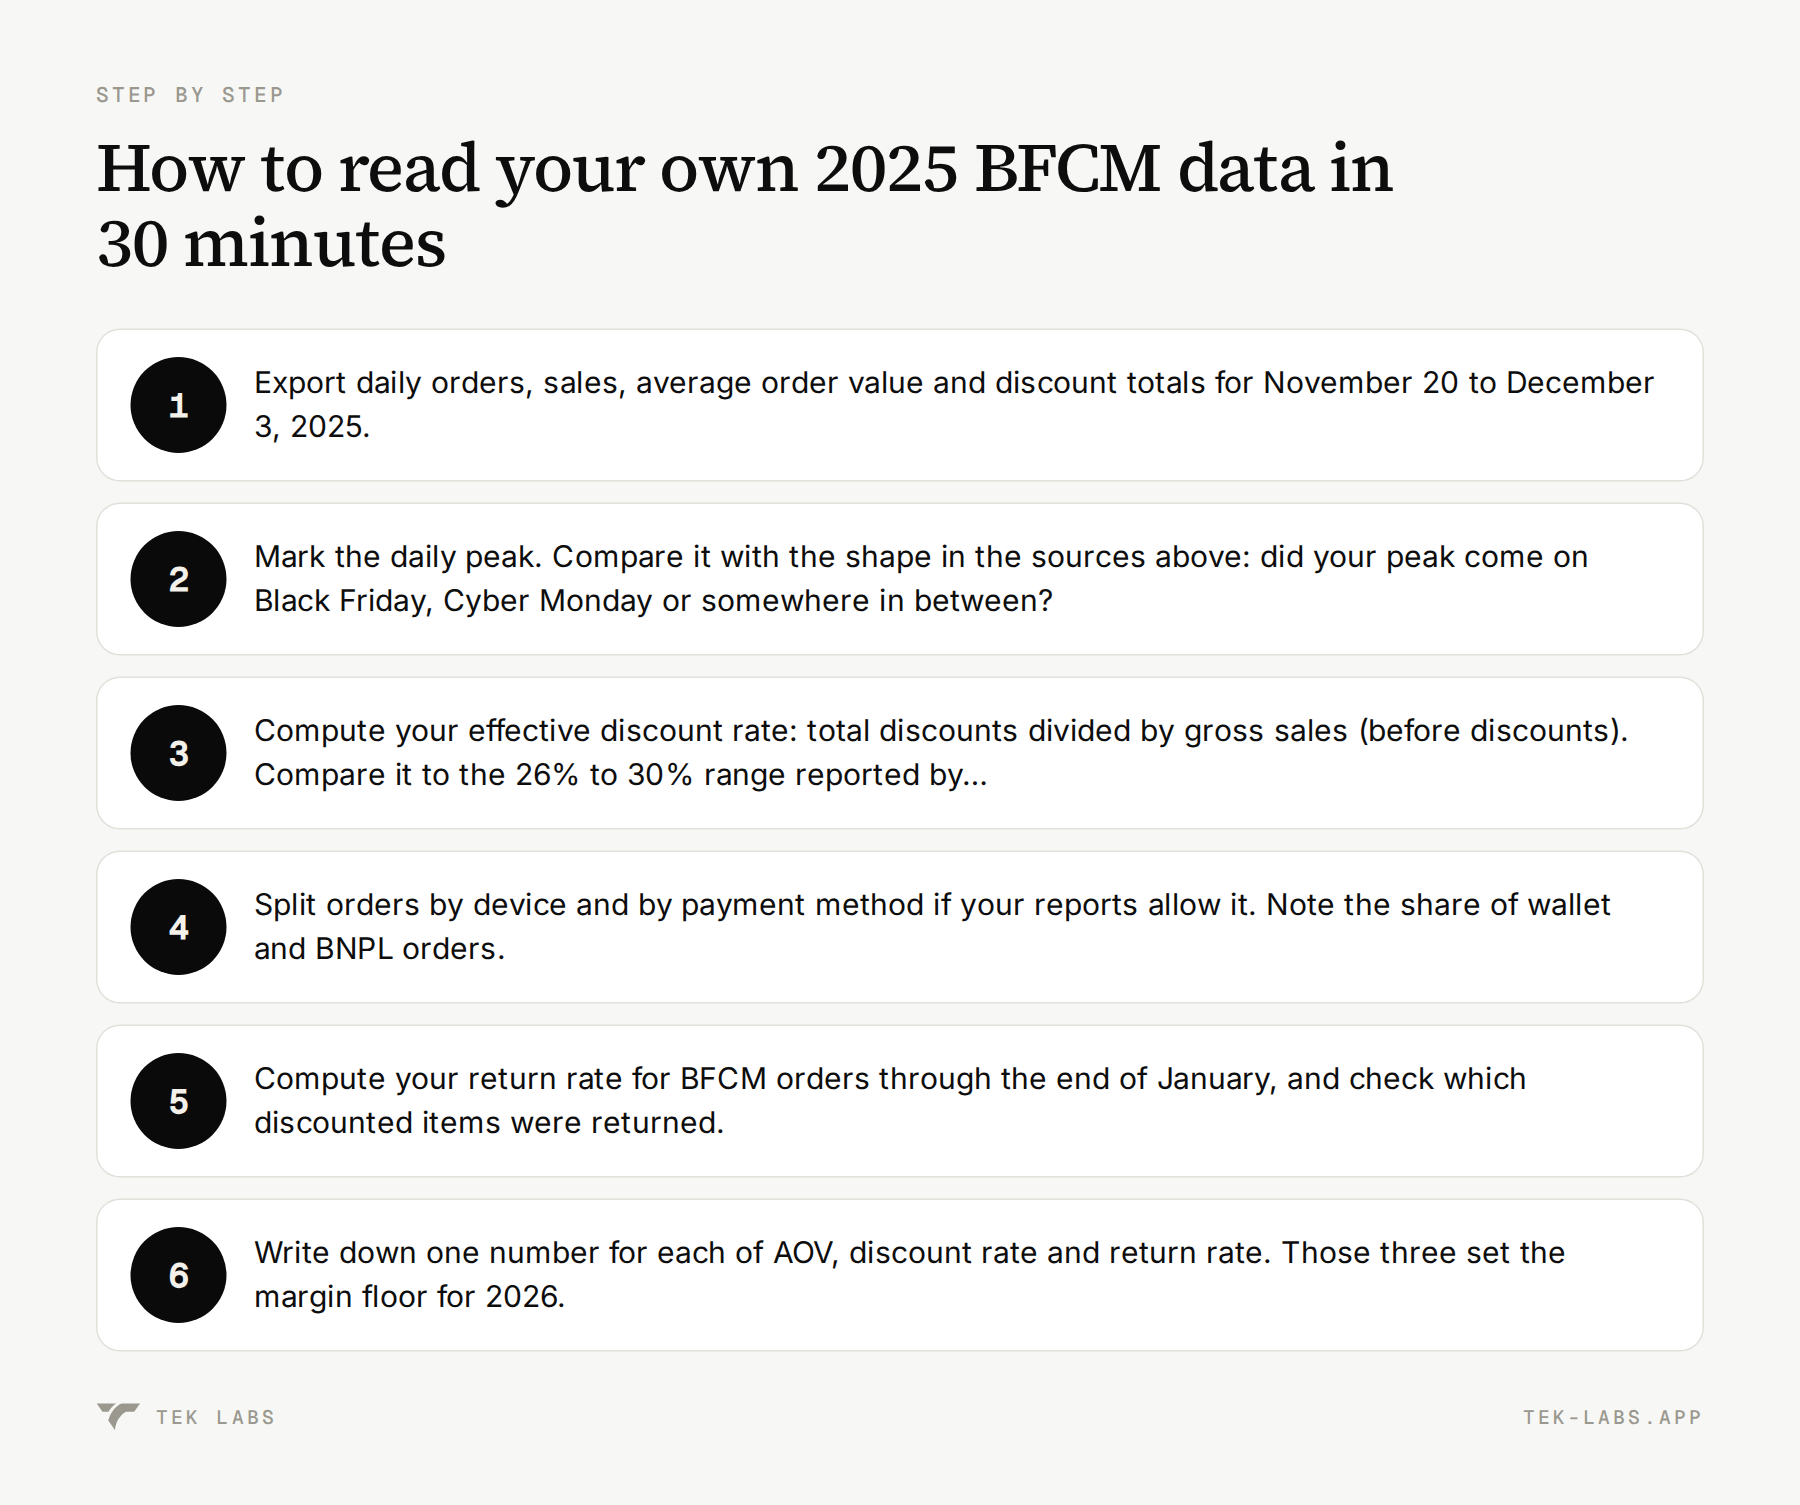
Benchmarks help, but your own numbers decide the plan. Open your Shopify admin reports and work through these steps.
- Export daily orders, sales, average order value and discount totals for November 20 to December 3, 2025.
- Mark the daily peak. Compare it with the shape in the sources above: did your peak come on Black Friday, Cyber Monday or somewhere in between?
- Compute your effective discount rate: total discounts divided by gross sales (before discounts). Compare it to the 26% to 30% range reported by Klaviyo and Adobe.
- Split orders by device and by payment method if your reports allow it. Note the share of wallet and BNPL orders.
- Compute your return rate for BFCM orders through the end of January, and check which discounted items were returned.
- Write down one number for each of AOV, discount rate and return rate. Those three set the margin floor for 2026.
A hypothetical example, with made-up numbers. A store had 4,000 BFCM orders in 2025 at an AOV of $88, gross sales of $352,000 and discounts of $112,640. The effective discount rate is $112,640 divided by $352,000, which is 32%. That is above Klaviyo’s 26.2% average and Adobe’s category peaks in apparel (25.1%). The store gave away more than the market did, which suggests room to cut percentage depth and replace part of it with a basket-based reward. If it cut the effective rate to 26%, discounts would fall to $91,520 on the same gross sales, saving $21,120 before accounting for any change in order volume. Whether volume would hold is the question to test, and the timeline in the playbook includes an early test.
Common mistakes when reading BFCM data
- Comparing numbers from different sources as if they measured the same thing (Adobe spend, Salesforce global sales, Shopify merchant sales and NRF shopper counts all differ).
- Treating the 27% Shopify platform growth as a forecast for one store.
- Planning against a forecast and not the actuals. In 2025 Adobe’s discount forecast was lower than the discounts that happened.
- Matching the deepest discount you see in a category average. Averages mix very different products and brands.
- Ignoring January. The post-Christmas returns spike belongs in the margin calculation.
- Building a plan around AI traffic that is still a small share of visits.
Where to go from here
If most of your 2025 conversation was about discount depth, switch it to basket size and timing. Free Gifts BOGO & Upsell lets you test a spend threshold, a milestone bar and a BOGO offer on a free plan before November, and the free gift calculator shows whether a given threshold pays for the gift at your AOV. For the cart abandonment side of the same weekend, see our guide to tackling cart abandonment, and for vocabulary, the glossary defines AOV, BOGO and the other terms used here.
Frequently Asked Questions
When is Black Friday 2026?
Black Friday 2026 is Friday, November 27. Thanksgiving is Thursday, November 26, and Cyber Monday is Monday, November 30.
How much did online shoppers spend during BFCM 2025?
Adobe measured $44.2 billion in US online spending across Cyber Week 2025 (up 7.7%), including $11.8 billion on Black Friday and $14.25 billion on Cyber Monday. Salesforce measured $336.6 billion globally, and Shopify merchants alone sold $14.6 billion over the BFCM weekend.
Do I need to discount more than 30% to compete?
The 2025 data does not say so. Klaviyo measured an average ecommerce discount of 26.2% and found that brands with the lightest discounts grew fastest in its data, while Adobe’s category peaks ranged from about 19% to 31%. Compare your effective discount to those numbers and test basket-based rewards before you cut price further.
Is mobile really the majority of BFCM sales?
Yes by most measures, but the share depends on what is counted. Adobe reported 56.4% of season spend and 57.5% of Cyber Monday spend on mobile, while Salesforce reported 70% of online orders.
Should I plan for AI shopping traffic in 2026?
Plan lightly. Adobe measured a very large percentage increase in AI-referred traffic in 2025 but said the base remains modest, so the practical step is keeping your product, offer and policy information clear and consistent.