Compare funnels
Filter by funnel to see which offer set earns more.
Upsell analytics dashboard
Track how your post purchase and thank you page offers perform, with a funnel chart, revenue trends, and a list of orders that included an upsell.
What it is
The Analytics page shows total order revenue, total upsell revenue, and the number of orders with upsells for the period you choose. A funnel chart shows upsell views, add to carts, and orders. Two line charts track upsell revenue and orders with upsell over time, by day or by month.
Below the charts a table lists each order with its customer, funnel, page, order total, and upsell revenue. You can filter by funnel and by date range, so you can compare which funnel earns the most.
For the shopper
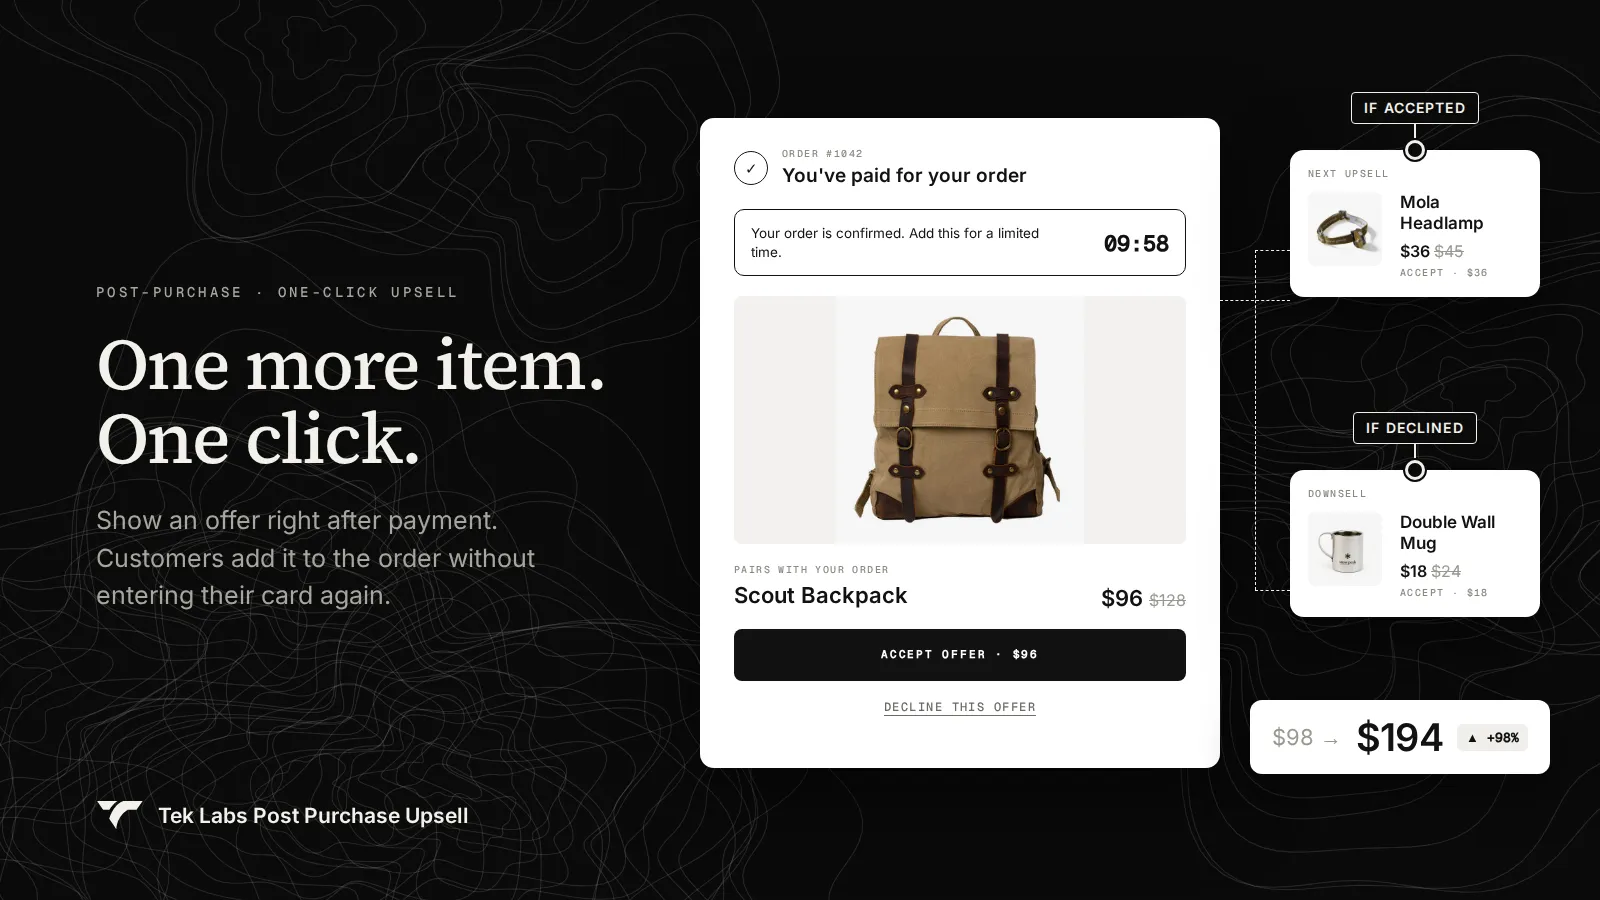
Scroll through the steps. The phone shows what the shopper sees at each one; products and prices are an example.
Each time a customer sees an upsell on the post purchase page or thank you page, a view event is recorded.
When a customer accepts an offer, an add to cart event is recorded.
The app links the order and upsell revenue to the funnel and the page that produced it.
Open Analytics, pick a funnel and date range, and read the cards, charts, and orders table.
For you
Options you control
Activate a funnel with a post purchase upsell or thank you page recommendations so there is data to measure.
Click Analytics in the app menu.
Pick a funnel and a date range such as Last 30 days.
Compare views, add to carts, and orders in the funnel chart, then open the orders table to see which orders carried upsell revenue.
Use cases
Filter by funnel to see which offer set earns more.
Use Total upsell revenue to show what the app added.
A low add to cart rate against views signals the offer or layout needs work.
FAQ
The app records a view when an upsell is shown and an add to cart when the customer accepts an offer, on either the post purchase page or the thank you page.
Post-purchase and Thank you pages. The orders table has a Page column for this.
Yes. Use the funnel filter at the top of the page.
Upsell and downsell funnels, thank-you page offers: our team sets it up with you and checks it before it goes live.
Free to install. Built for Shopify. Rated 4.9 from 30 reviews.