Prove a gift pays off
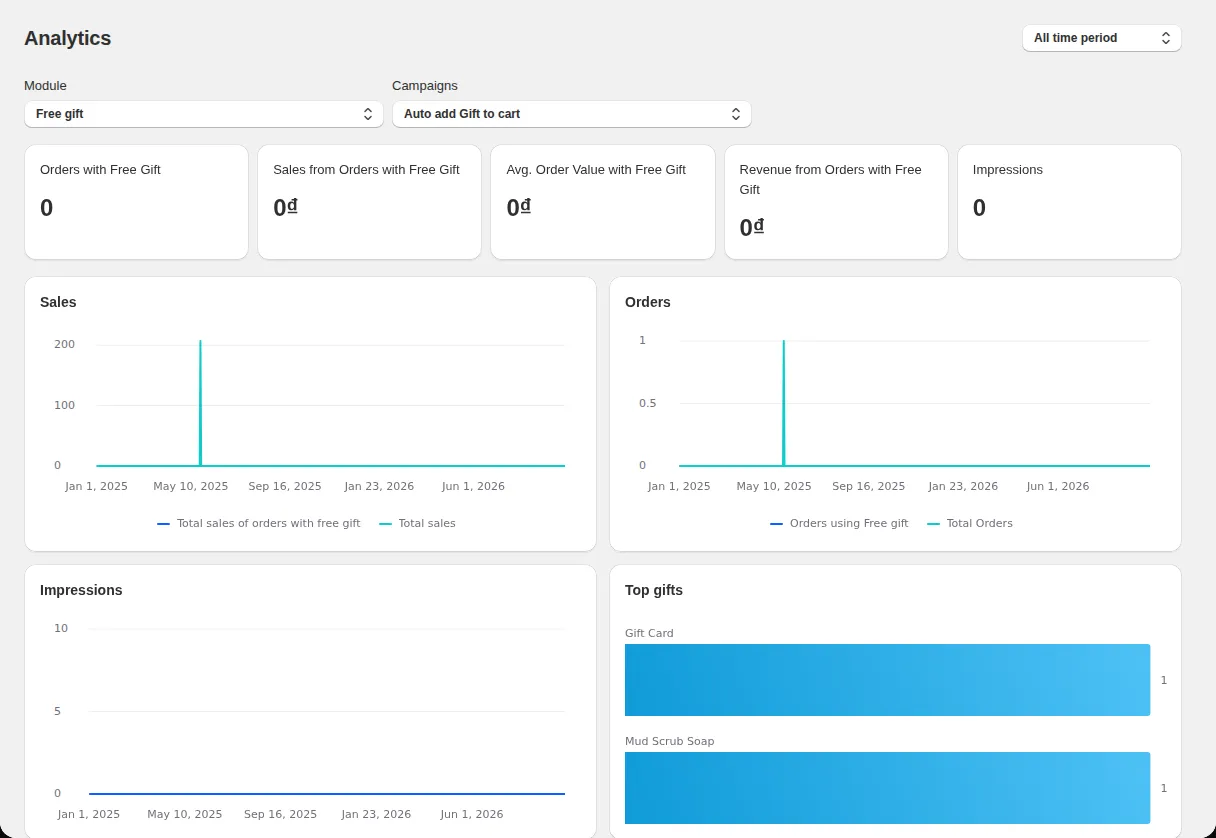
Compare sales from orders with a gift to your total sales.
Offer analytics dashboard
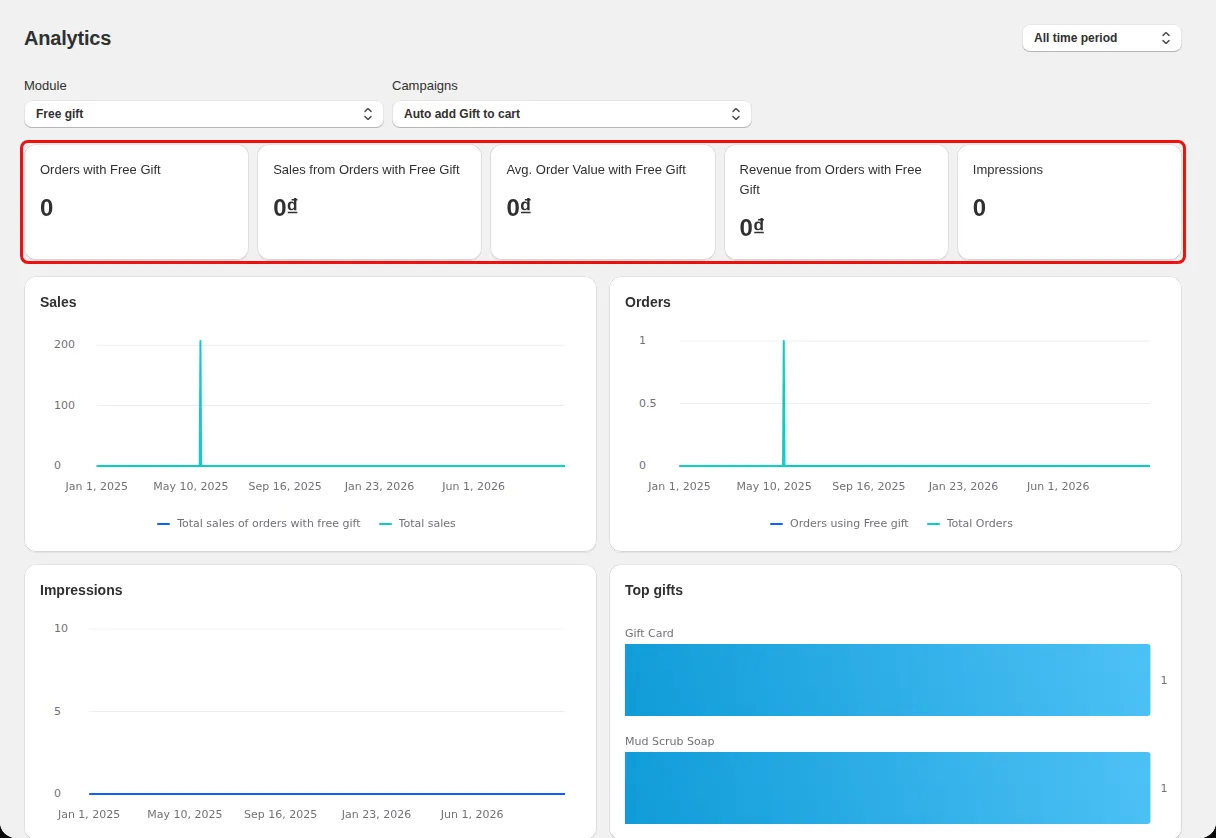
See how your offers perform: orders with gifts, sales, average order value, revenue after gift cost, impressions, and top gifts, by module and campaign.
What it is
The Analytics page shows summary cards and charts for each offer module: Free gift, Embed Gift, Popup Gift, Progress bar, Volume Discount, Package Deal, BOGO, You may also like, and Gift discount code. You can filter by campaign and by date range.
Use it to learn which gift or bar actually lifts order value, and to see which gifts are chosen most. Impression counts show how often visitors reached a page with the offer.
For the shopper
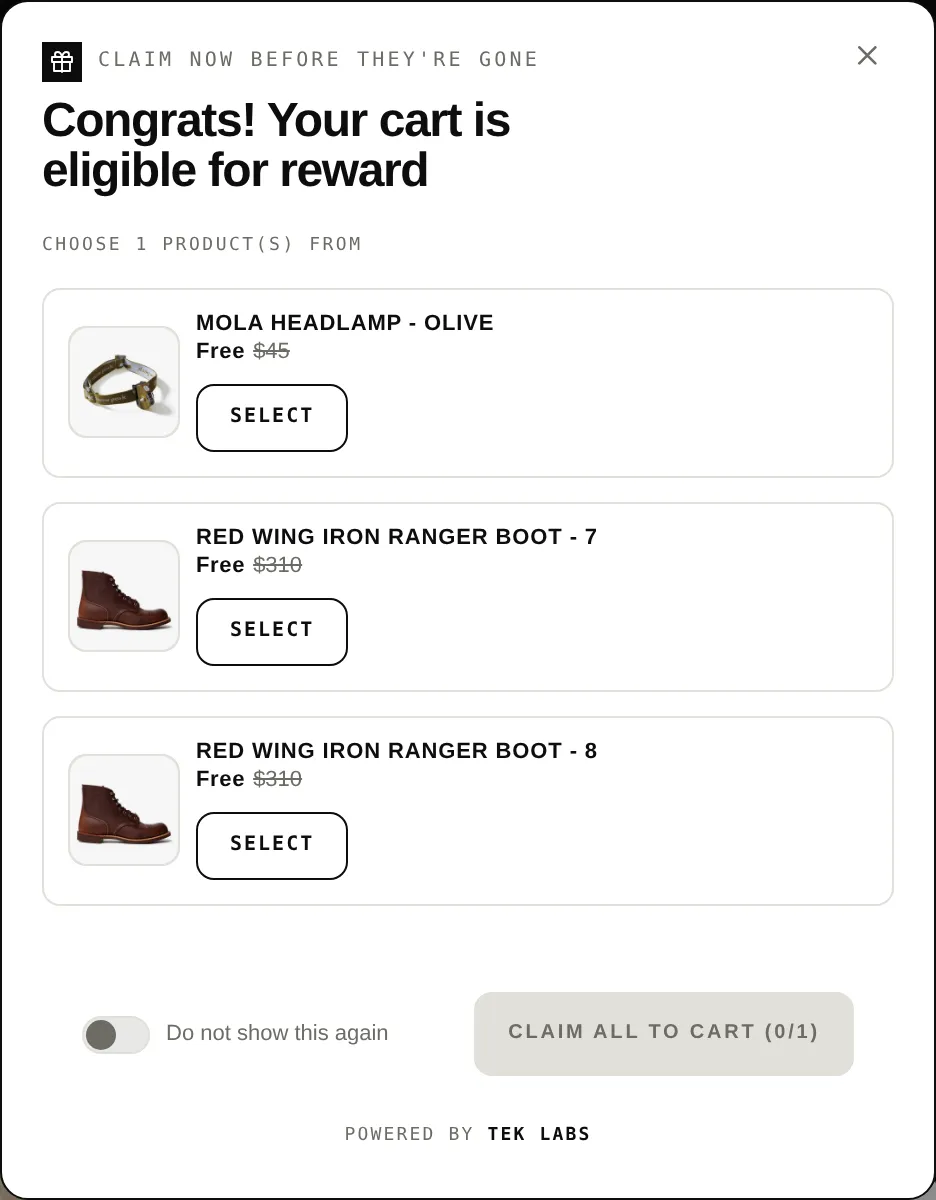
Scroll through the steps. The phone shows what the shopper sees at each one; products and prices are an example.
The page loads the totals for the selected module and dates.
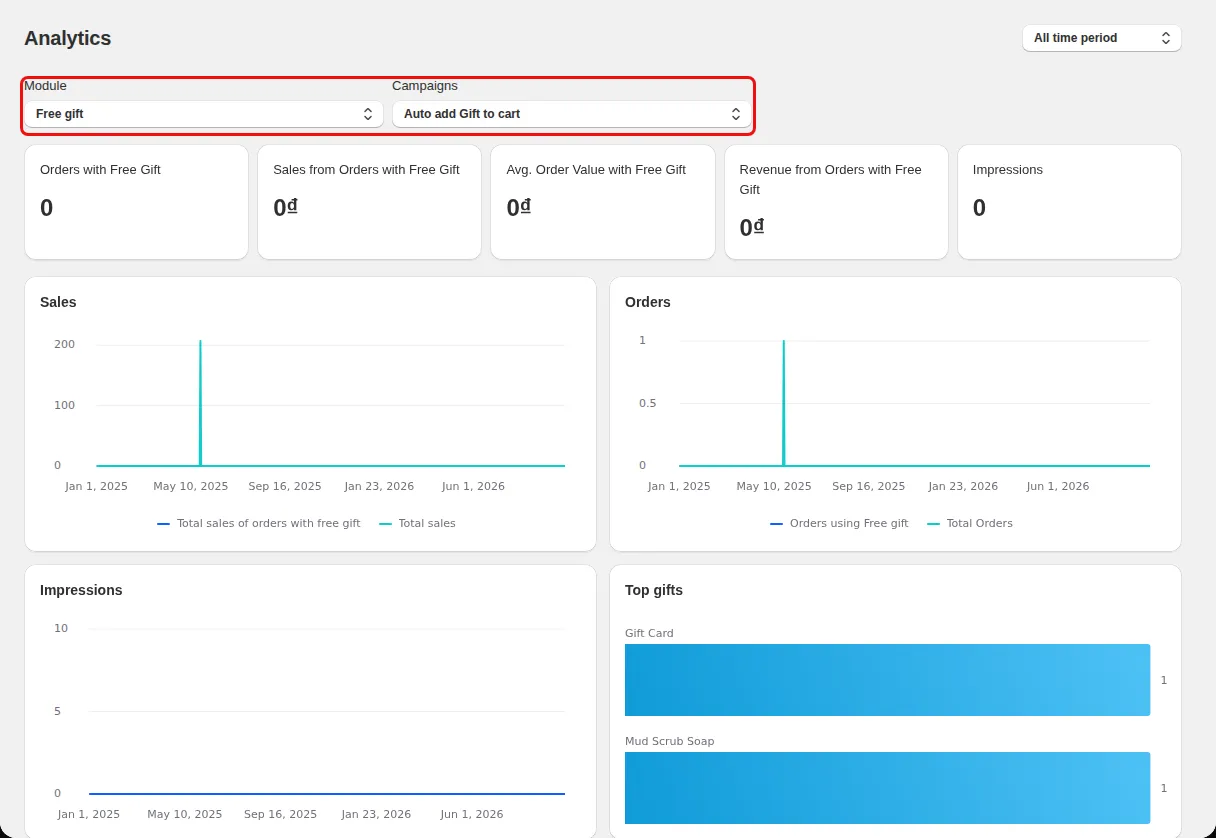
Choose the module and then one campaign, or all.
Cards show orders, sales, average order value, revenue, and impressions.
Charts show sales, orders, impressions over time, and top gifts.
For you
Options you control
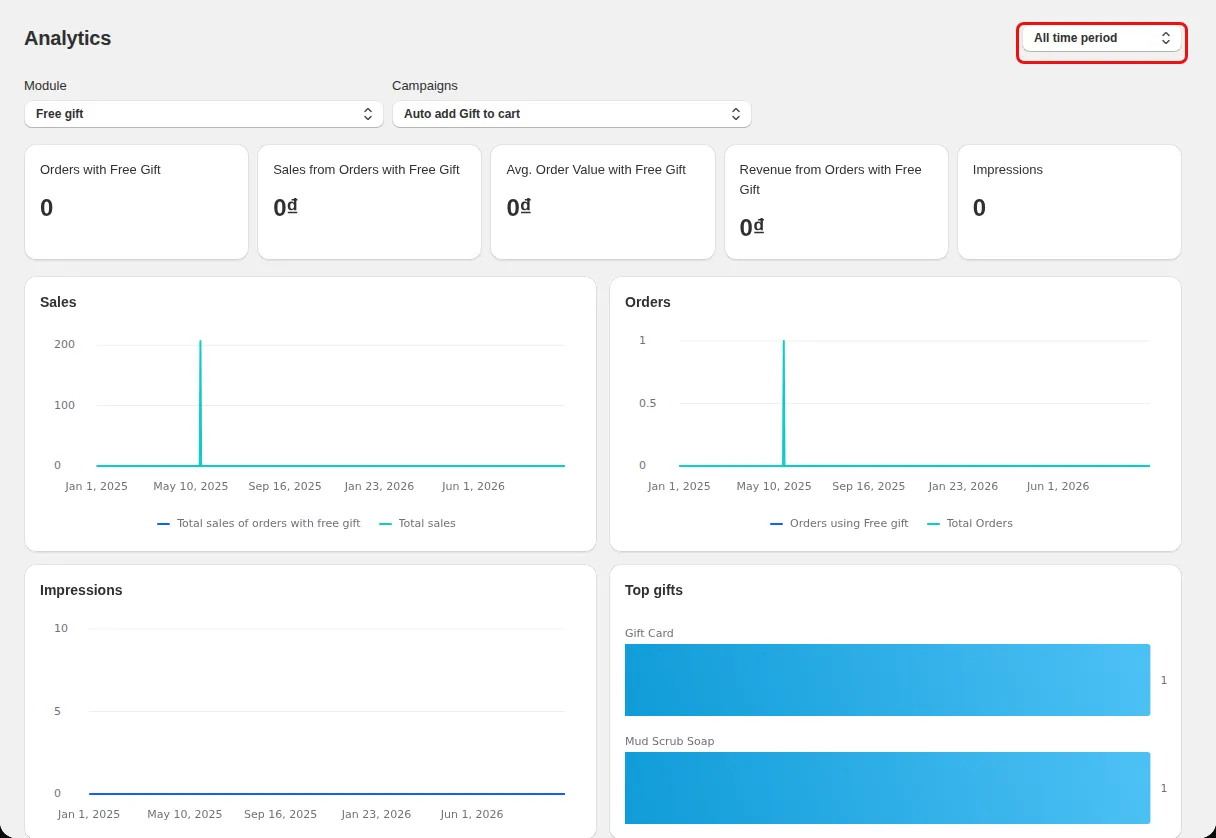
Pick All time period, Last 7 days, Last 30 days, or a Custom date range.
Use the Module filter, then use Campaigns to narrow to one offer.
Review the cards and charts. If you see Unlock Analytics to see full stats, the feature is limited on your plan.
Use cases
Compare sales from orders with a gift to your total sales.
Check the Top gifts chart.
Low impressions can point to a placement problem.
FAQ
The app defines it as the total revenue generated by orders with free gifts after deducting the price of the gifts.
For product page modules it is a visit to a product page that shows the offer. For the popup it is a click that opens the popup.
The code shows an Unlock Analytics message and a limit banner for some plans. Check the Pricing page for your plan.
Related features
Free gifts, BOGO, bundles and progress bars. Every offer type, on a free plan to start.